
Kai Wagner · 2 October 2026
Adapting Dashboard Visualization Methods to Meet Varying Regional Data Residency Requirements in SaaS Environments
Organizations operating SaaS platforms face increasing pressure to keep certain datasets within defined geographic boundaries, and dashboard visualization tools must adjust accordingly to display metrics without triggering cross-border transfers that violate local statutes. Data residency rules vary sharply by jurisdiction, which forces engineering teams to segment storage locations and processing logic so that visual outputs remain compliant while still delivering timely insights to users in multiple countries. In October 2026 several jurisdictions plan to enforce updated localization mandates that will affect how real-time charts aggregate information from distributed sources.
Core Challenges in Visualization Compliance
Traditional dashboard engines pull raw records into a central analytics layer before generating graphs and tables, yet this workflow collides with residency statutes that require personal or sensitive data to remain inside specific national borders. Engineers therefore explore methods such as federated query layers that execute calculations inside each region before returning only aggregated results, and they combine those techniques with client-side rendering libraries that assemble visual elements after the minimal necessary summaries arrive. Observers note that latency increases when queries must route through regional gateways, and teams mitigate the delay by caching non-sensitive metadata closer to end users while keeping the underlying records in place.
Regional Regulatory Landscape
European rules emphasize strict localization for certain categories of personal data, and similar frameworks appear in other territories that require explicit consent or technical safeguards before any movement occurs. Canadian regulators maintain guidance on cross-border transfers that SaaS providers reference when designing multi-region dashboards, while Australian authorities publish sector-specific expectations for health and financial information that influence how visualization platforms filter or mask fields prior to display. These overlapping requirements mean product teams maintain separate data pipelines for each region and route visualization requests to the appropriate endpoint based on user location and data classification tags.
Research from academic groups studying distributed systems shows that edge-based rendering reduces the volume of data leaving a region by up to seventy percent when only pre-computed aggregates travel across boundaries. Implementation details differ: some platforms embed lightweight analytics runtimes inside each sovereign cloud zone, whereas others rely on secure multiparty computation protocols that allow joint calculations without exposing individual records. Those approaches preserve visual fidelity because the final rendered charts receive the same numerical inputs they would have obtained under a centralized model.
Technical Adaptation Strategies
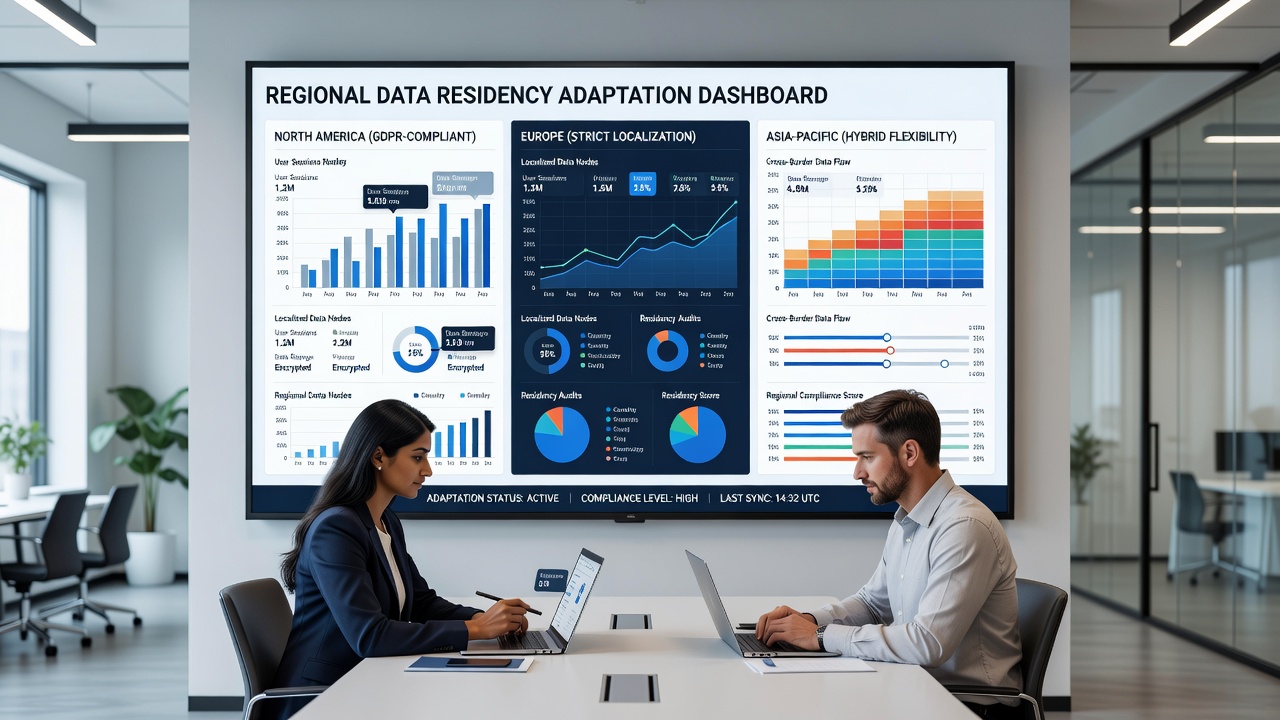
One effective pattern involves splitting the visualization stack into a thin global orchestration layer and multiple regional execution engines. The orchestration layer receives user queries, determines the residency zone, and forwards instructions to the local engine, which then returns only the data points required for the requested chart type. Developers further refine this model by applying differential privacy noise at the regional level so that even aggregated outputs do not inadvertently reveal individual entries when displayed on shared dashboards. Studies from distributed database research indicate that such noise levels can stay below visual detection thresholds while satisfying statutory audit requirements.
Another technique uses dynamic data masking within the visualization library itself, swapping sensitive identifiers for hashed tokens before any rendering occurs. This method works well when dashboards must combine metrics from several regions on a single screen, because the tokens allow correlation without exposing the original values. Platform operators document these masking rules in compliance playbooks so that auditors can verify the process matches the residency commitments stated in service agreements.
Implementation Examples Across Industries
Financial SaaS providers illustrate one practical case where transaction dashboards must respect residency rules for customer account details yet still surface trend lines that span multiple continents. Teams achieve this by maintaining mirrored schema definitions in each approved region and using query federation software to union the results after local filtering. Healthcare platforms follow a parallel path, restricting raw patient encounter data to domestic zones while permitting de-identified trend visualizations to appear in global administrative views. Observers record that both sectors invest heavily in automated policy engines that tag incoming records with residency attributes and enforce routing rules at ingestion time.
Industry reports from research institutions highlight that companies adopting these segmented architectures experience fewer compliance incidents during regulatory reviews, although they incur higher operational overhead for maintaining synchronized visualization templates across zones. The overhead manifests in duplicated caching layers and additional monitoring dashboards that track latency and error rates per region, yet the cost remains predictable once the initial segmentation logic stabilizes.
Conclusion
Adapting dashboard visualization methods to regional data residency constraints requires deliberate separation of storage, processing, and rendering responsibilities so that each jurisdiction retains control over its data while users continue to receive coherent visual summaries. Organizations that embed residency awareness into the visualization pipeline from the outset avoid costly retrofits when new mandates take effect, and they position their platforms to accommodate future regulatory shifts without sacrificing analytical capability.